
pandas의 DataFrame에서는 format, highlighting 등 여러 가지 style을 지정할 수 있습니다. (경험에 의하면) style의 지정은 단순히 이쁘게 보여주는 기능 외에도 하나의 column 내에서 값을 비교하거나, 관심있는 수치 구간을 확인할 때 직관적으로 원하는 정보를 쉽게 얻을 수 있다는 장점이 있었습니다.
Data
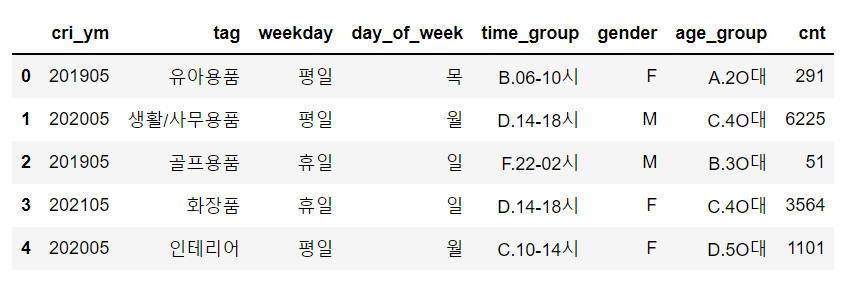
코드 작성에는 ‘KDX 한국데이터거래소’에 있는 삼성카드 온라인쇼핑 요일/시간대별 이용 특징 데이터를 사용하였습니다. 데이터는 온라인쇼핑의 세부 업종별 소비 특징 데이터로, ‘19.5월/’20.5월/’21.5월 기간에 대해 14개의 주요 온라인 쇼핑 업종의 연령/성별/구매시간대별 소비 건수를 집계한 데이터입니다.
1
2
3
4
5
6
import numpy as np
import pandas as pd

ssc_online = pd.read_excel("KDX2021_SSC_ONLINE_DATA.xlsx")
ssc_online.columns = ['cri_ym','tag','weekday','day_of_week','time_group','gender','age_group','cnt']
ssc_online.head()
background_gradient
background_gradient 함수를 통해 데이터의 배경에 colormap을 적용시킬 수 있습니다.
함수설명
| parameters | 형태 | 설명 |
|---|---|---|
| cmap | str or colormap | |
| axis | {0 or ‘index’, 1 or ‘columns’, None}, default 0 | 0: 각 col별로, 1: 각 row별로 적용 |
| subset | label, array-like, IndexSlice | 적용하고 싶은 column |
| text_color_threshold | float or int | [0, 1] 사이의 값 |
| vmin/vmax | float | colormap의 최소값/최대값에 대응하는 값 |
| gmap | array-like | 주어진 axis와 subset에 따라 전체 적용 |
data aggreation
결과를 쉽게 확인하기 위해 아래와 같이 데이터를 축소시켜 함수를 적용하겠습니다.
1
2
3
tmp = ssc_online.groupby(['gender','tag'],as_index=False).agg({'cnt':'mean'})
tmp1 = tmp.head(10)
tmp1
subset
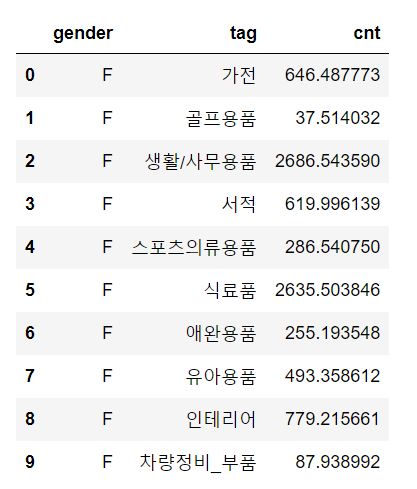
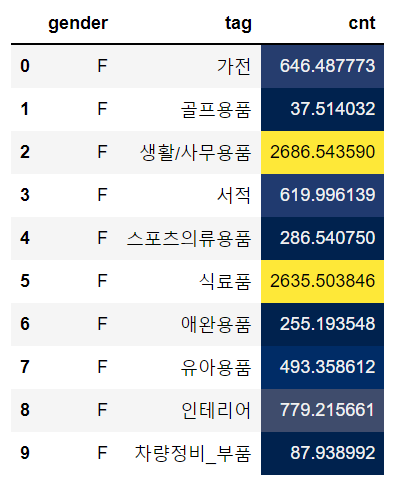
subset 옵션을 통해 ‘cnt’에만 배경 스타일이 적용됨을 확인할 수 있습니다.
1
tmp1.style.background_gradient(cmap='cividis', subset=['cnt'], axis=0)
적용 가능한 colormap은 matplotlib 공식문서를 통해 알 수 있습니다.
text_color_threshold
text_color_threshold 옵션은 ‘0’이면 어둡게 ‘1’이면 밝게 글자를 보여줍니다.
1
tmp1.style.background_gradient(cmap='cividis', subset=['cnt'], axis=0, text_color_threshold=0)
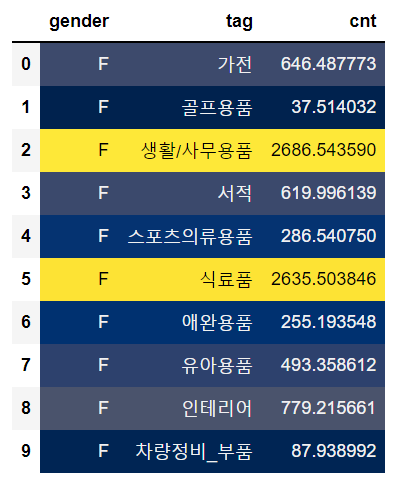
vmin & vmax
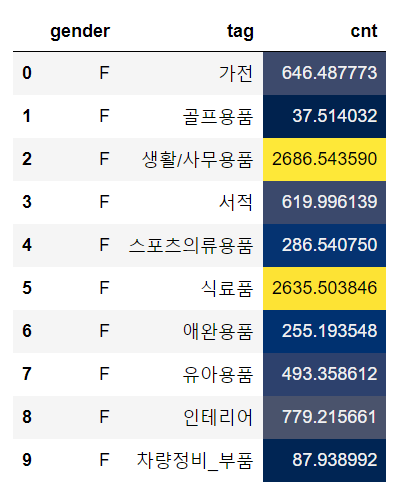
vmin, vmax 옵션은 colormap의 최소, 최대와 대응하는 값입니다. 아래 코드의 결과는 ‘400’ 이하, ‘2000’이상의 값들이 각각 동일한 색으로 표시된 것을 확인할 수 있습니다.
1
tmp1.style.background_gradient(cmap='cividis', subset=['cnt'], axis=0,vmin=400,vmax=2000)
gmap
gmap 옵션은 정의한 axis와 subset에 대한 결과를 전체 index 또는 column에 동일하게 적용하는 옵션입니다. 해당 옵션은 1.3.0 이상의 버전에서 지원합니다.
1
tmp1.style.background_gradient(cmap='cividis', gmap=tmp1['cnt'], axis=0)
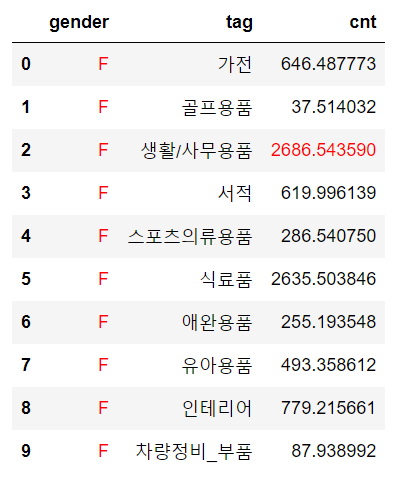
style.apply
style.apply 함수를 통해 CSS-styling을 적용할 수 있습니다.
함수설명
| parameters | 형태 | 설명 |
|---|---|---|
| func | function | 적용할 함수 |
| axis | {0 or ‘index’, 1 or ‘columns’, None}, default 0 | 0: 각 col별로, 1: 각 row별로 적용 |
| subset | label, array-like, IndexSlice | 적용하고 싶은 column |
| **kwargs | dict | func에 대한 옵션 |
1
2
3
4
def highlight_max(x, color):
    return np.where(x == np.nanmax(x.to_numpy()), f"color: {color};", None)

tmp1.style.apply(highlight_max, subset=['gender','cnt'], axis=0, color='red')
style.highlight_between
style.highlight_between 함수를 통해 정의된 구간에 대해 스타일을 적용할 수 있습니다.
함수설명
| parameters | 형태 | 설명 |
|---|---|---|
| subset | label, array-like, IndexSlice | |
| color | str | 배경 색 |
| axis | {0 or ‘index’, 1 or ‘columns’, None}, default 0 | 0: 각 col별로, 1: 각 row별로 적용 |
| left/right | scalar or datetime-like, or sequence or array-like | 구간의 하한/상한값 |
| inclusive | {‘both’, ‘neither’, ‘left’, ‘right’} | 경계값 포함 여부 |
| vmin/vmax | float | colormap의 최소값/최대값에 대응하는 값 |
| props | str | 해당 옵션을 이용하면 color옵션은 사용되지 않음 |
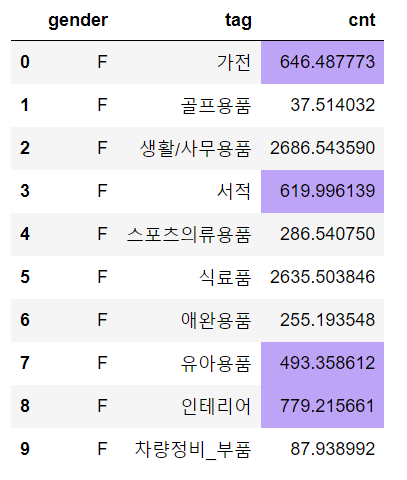
color
‘Hex color code’는 html-color-codes를 통해 쉽게 알 수 있습니다.
1
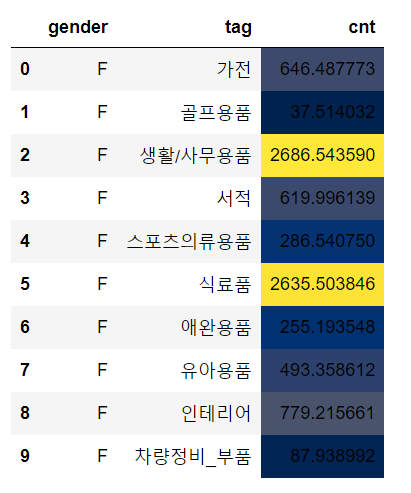
tmp1.style.highlight_between(subset=['cnt'], left=400, right=2000, axis=1, color="#BDA4F6")
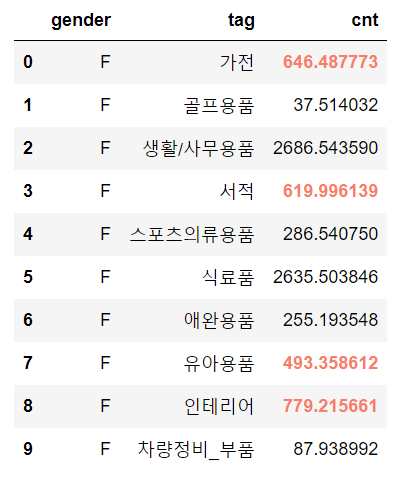
props
props 옵션을 통해 CSS properties를 적용할 수 있습니다.
1
tmp1.style.highlight_between(subset=['cnt'], left=400, right=2000, axis=1, props='font-weight:bold;color:#F97D69')
style.highlight_between 외에도 특정값에 highlight를 지원하는 다양한 함수들이 있습니다. 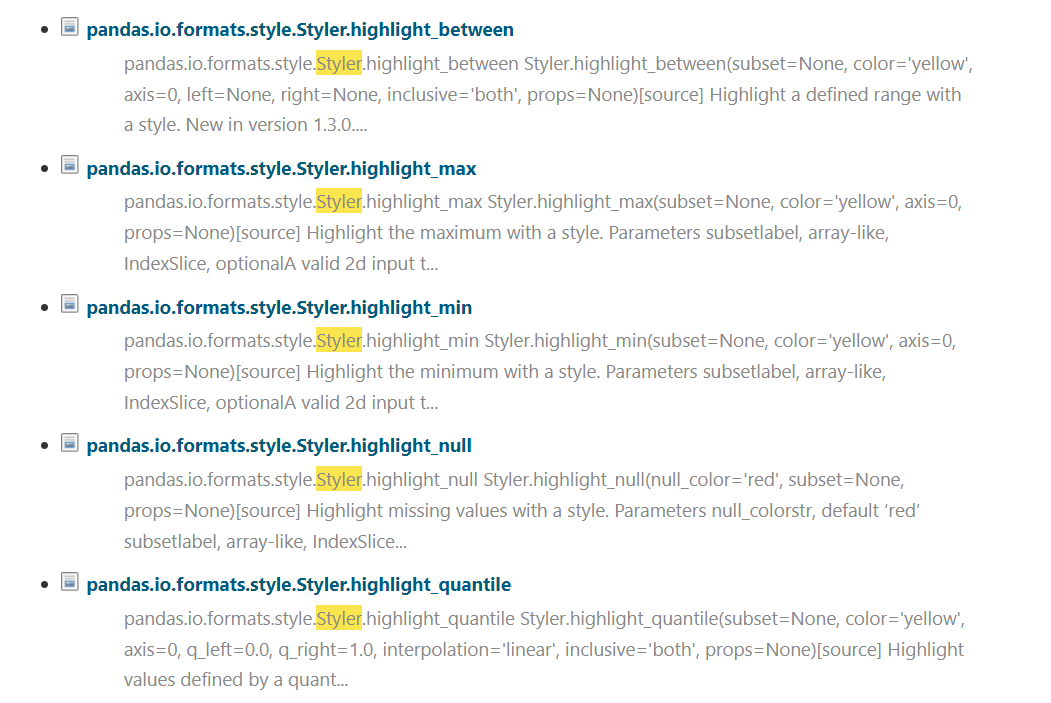
마지막으로, pandas에서는 highlight 기능 뿐만 아니라 format과 관련한 다양한 함수들도 지원하고 있으니 관심이 있다면 공식문서를 확인해보는 것을 추천합니다.