
이전 글을 통해 pandas의 데이터프레임의 셀들의 배경과 텍스트에 스타일을 설정하는 방법에 대해서 알아보았습니다. 이번에는 index나 header 등 다른 요소들에 스타일을 설정하는 방법과 더불어 유용한 기능을 알아보고자 합니다. 본문은 pandas 공식문서에 있는 ‘Table Visualization’ 부분 중 일부를 정리했습니다.
1
2
3
4
5
6
7
import pandas as pd
import numpy as np

df = pd.DataFrame([[38.0, 2.0, 18.0, 22.0, 21, np.nan],[19, 439, 6, 452, 226,232]],
                  index=pd.Index(['Tumour (Positive)', 'Non-Tumour (Negative)'], name='Actual Label:'),
                  columns=pd.MultiIndex.from_product([['Decision Tree', 'Regression', 'Random'],['Tumour', 'Non-Tumour']], names=['Model:', 'Predicted:']))
df.style

위와 같은 데이터프레임을 이용합니다. 참고로 pd.get_option('display.precision')을 이용하면 default가 6으로 설정되어 있기 때문에 df.style을 이용하면 소수점 이하 6째 자리까지 보여집니다.
값 포맷 변경
1
2
3
4
df.style.format(precision=0, na_rep='MISSING', thousands=",",
                formatter={('Decision Tree', 'Tumour'): "{:.2f}",
                           ('Regression', 'Non-Tumour'): lambda x: "$ {:,.1f}".format(x*-1e6)
                          })
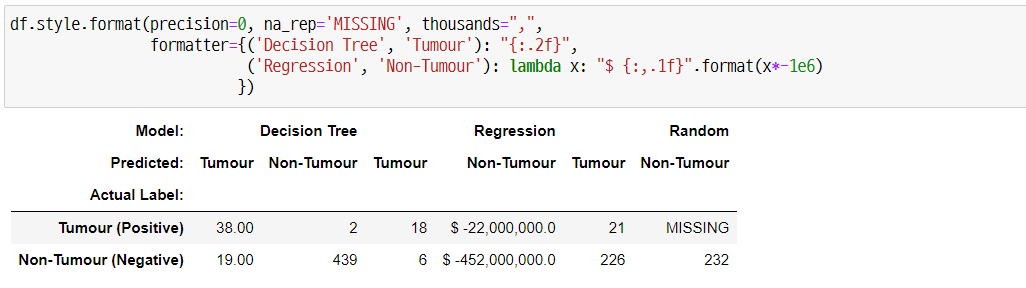 ‘precision’ 옵션은 ‘formatter’에서 지정한 칼럼 이외의 유효숫자에 대한 옵션입니다. 그리고 ‘na_rep’ 옵션을 통해 결측값을 어떻게 표시할지, ‘thousands’ 옵션을 통해 1000 단위 구분 기호를 지정해줄 수 있습니다. 마지막으로 ‘formatter’를 통해 컬럼별로 포맷을 지정해줄 수 있습니다.
스타일 적용
직접 CSS 스타일을 생성해서 Styler에 적용하는 방법은 크게 3가지가 있습니다.
.set_table_styles().set_td_classes().apply()&.applymap()
공식 문서에 따르면 방법 1과 2는 개별적인 CSS selectors와 properties를 추가하기 쉬우며, 방법 3은 특정 데이터 셀에 CSS를 추가하기에 쉽습니다. 자세한 내용은 관련 링크를 통해 확인할 수 있습니다.
set_table_styles() & .set_td_classes()
1
2
3
4
5
6
7
8
9
10
11
s = df.style.format('{:.0f}').hide_columns([('Random', 'Tumour'), ('Random', 'Non-Tumour')])

cell_hover = { # for row hover use <tr> instead of <td>
              'selector': 'td:hover',
              'props': [('background-color', '#F5dF4D')]}
index_names = {'selector': '.index_name',
              'props': 'font-style: italic; color: darkgrey; font-weight:normal;'}
headers = {'selector': 'th:not(.index_name)',
            'props': 'background-color: #6667AB; color: white;'}

s.set_table_styles([cell_hover, index_names, headers])
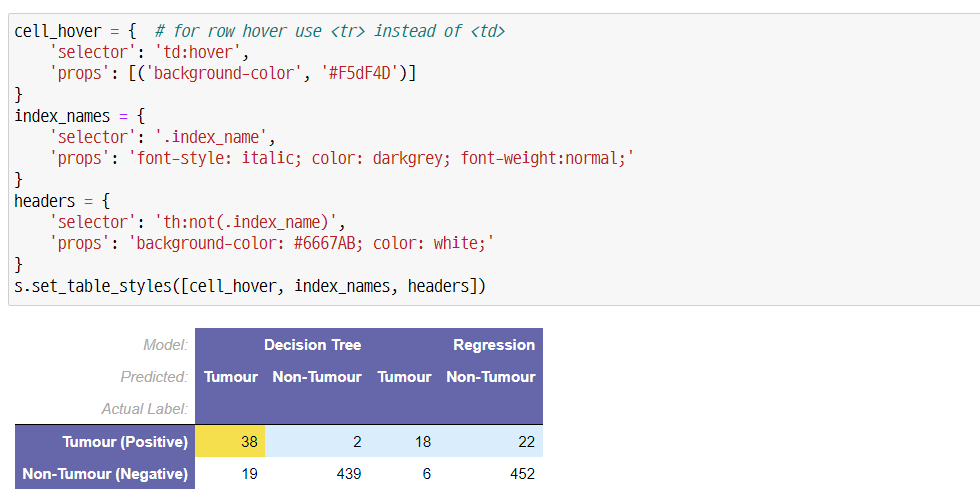
‘:hover’는 해당 셀 위에 마우스를 올렸을 때 스타일입니다. ‘index_names’와 ‘headers’와 같이 명시하여 인덱스와 헤더의 스타일을 지정할 수 있습니다. 그리고 아래와 같이 .set_table_styles() 함수를 chain-rule을 사용하여 스타일을 지정해줄 수 있습니다.
1
2
3
4
5
6
7
8
9
10
11
12
13
14
15
16
17
18
19
20
21
22
23
s.set_table_styles([
{'selector': 'th.col_heading', 'props': 'text-align: center;'},
{'selector': 'th.col_heading.level0', 'props': 'font-size: 1.5em;'},
{'selector': 'td', 'props': 'text-align: center; font-weight: bold;'},
],overwrite=False)
s.set_table_styles({
('Regression', 'Tumour'): [{'selector': 'th', 'props': 'border-left: 1px solid white'},
{'selector': 'td', 'props': 'border-left: 1px solid #000066'}]
}, overwrite=False, axis=0)
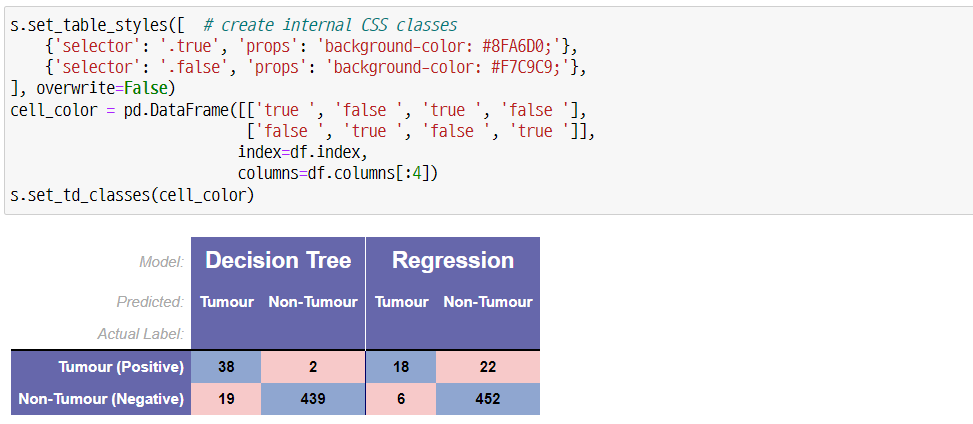
s.set_table_styles([ # create internal CSS classes
{'selector': '.true', 'props': 'background-color: #8FA6D0;'},
{'selector': '.false', 'props': 'background-color: #F7C9C9;'},
], overwrite=False)
cell_color = pd.DataFrame([['true ', 'false ', 'true ', 'false '],
['false ', 'true ', 'false ', 'true ']],
index=df.index,
columns=df.columns[:4])
s.set_td_classes(cell_color)
apply() & applymap()
1
2
3
np.random.seed(0)
df2 = pd.DataFrame(np.random.randn(10,4), columns=['A','B','C','D'])
df2.style
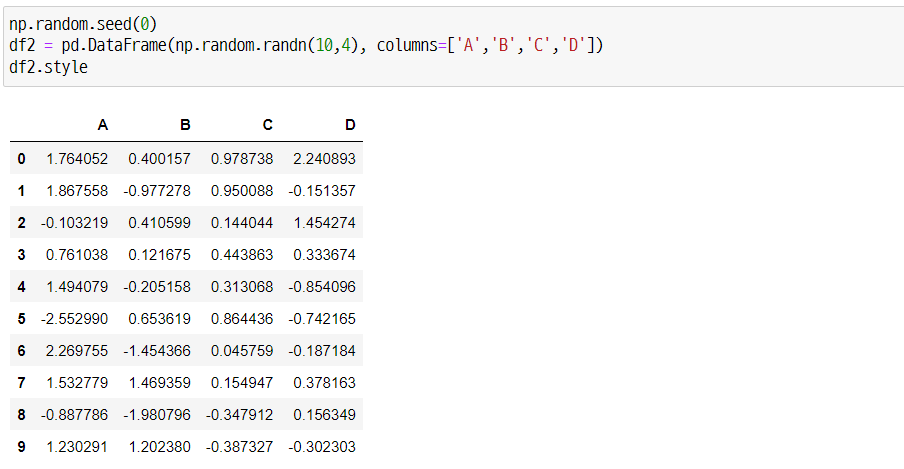
이번 설명에서는 위와 같은 데이터프레임을 이용합니다.
1
2
3
4
5
def style_negative(v, props=''):
    return props if v < 0 else None
s2 = df2.style.applymap(style_negative, props='color:red;')\
              .applymap(lambda v: 'opacity: 20%;' if (v < 0.3) and (v > -0.3) else None)
s2
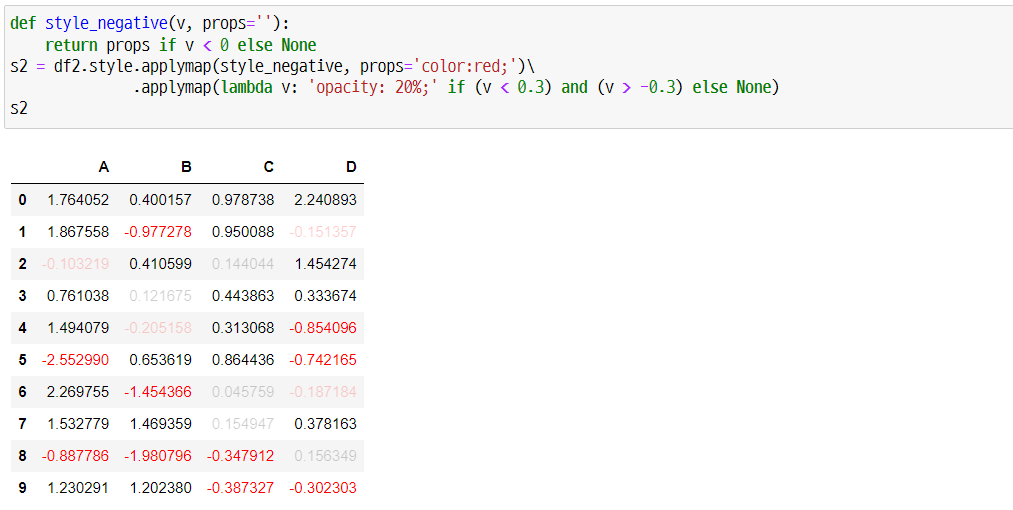
위와 같이 특정 조건에 따라 텍스트의 색이나 투명도를 조절할 수 있습니다. 그리고 이전 방법처럼 chain-rule을 활용해 여러 요소에 대해 각각 스타일을 적용할 수 있습니다.
1
2
3
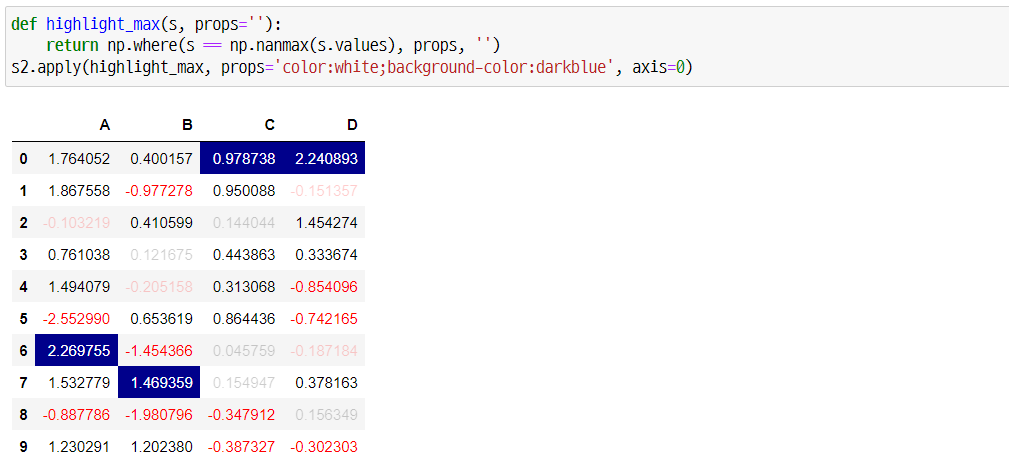
def highlight_max(s, props=''):
return np.where(s == np.nanmax(s.values), props, '')
s2.apply(highlight_max, props='color:white;background-color:darkblue', axis=0)
1
2
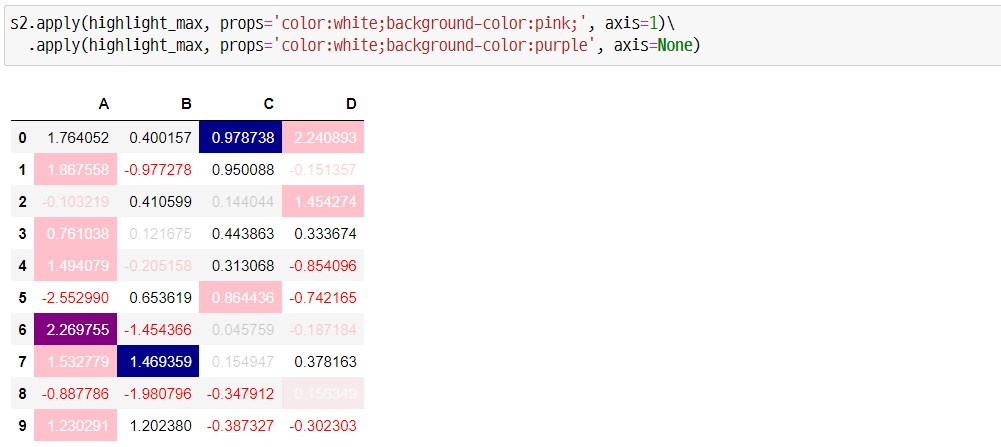
s2.apply(highlight_max, props='color:white;background-color:pink;', axis=1)\
.apply(highlight_max, props='color:white;background-color:purple', axis=None)
그 외 기능
Sticky Headers
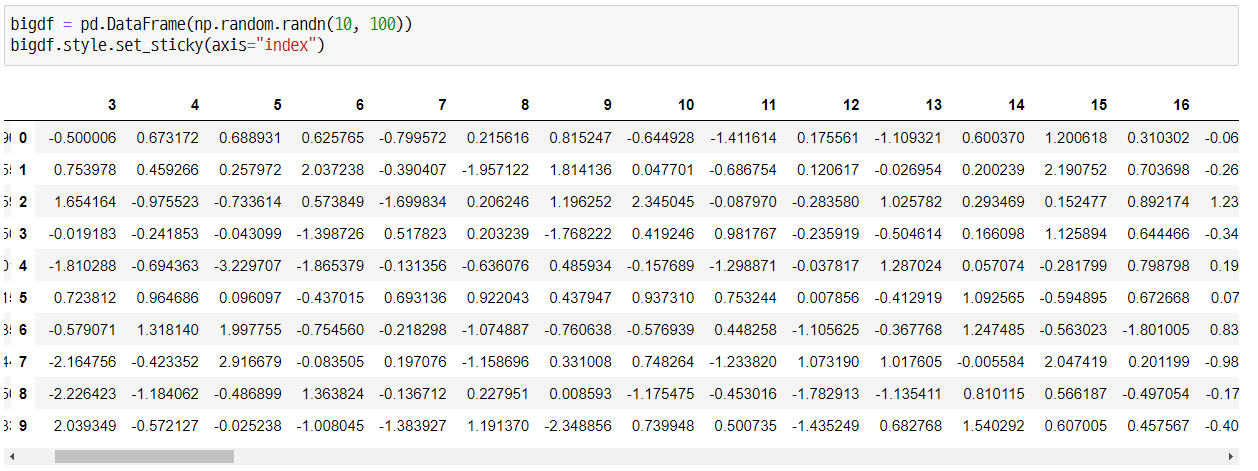
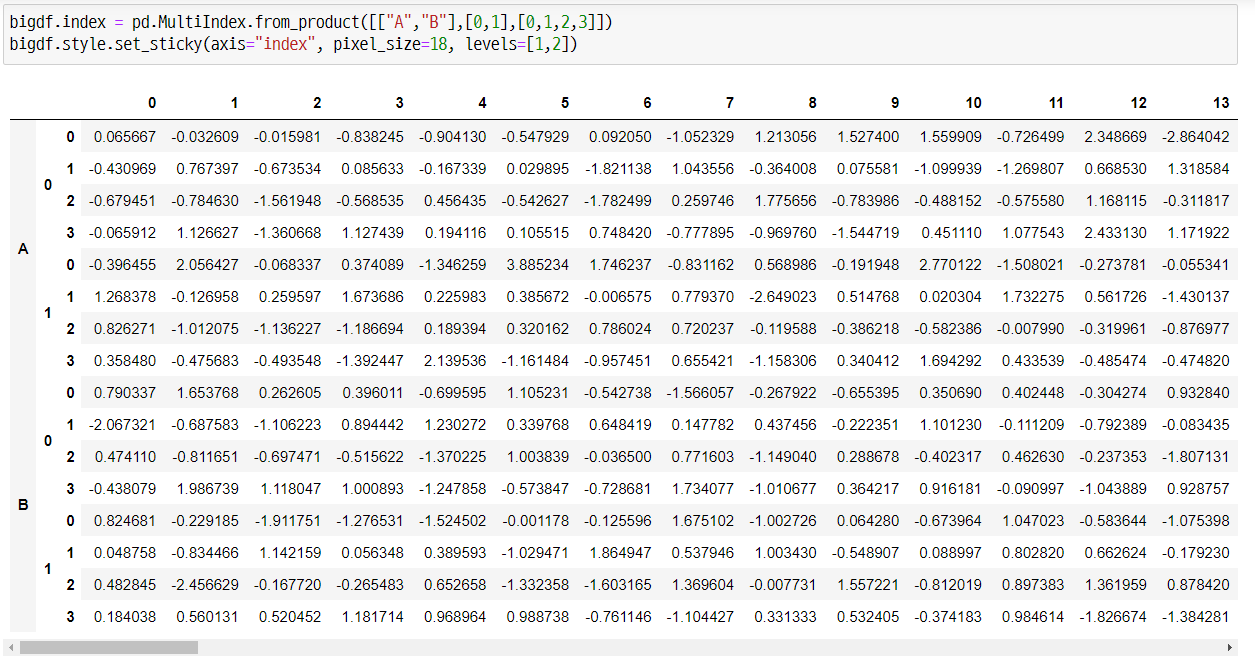
아래와 같이 .set_sticky() 함수를 이용하여 엑셀의 ‘틀고정’ 기능과 같은 기능을 지정할 수 있습니다. 그리고 멀티인덱스나 멀티컬럼의 경우 ‘levels’를 지정해 필요한 부분만 고정시키는 것도 가능합니다.
1
2
bigdf = pd.DataFrame(np.random.randn(16, 100))
bigdf.style.set_sticky(axis="index")
1
2
bigdf.index = pd.MultiIndex.from_product([["A","B"],[0,1],[0,1,2,3]])
bigdf.style.set_sticky(axis="index", pixel_size=18, levels=[1,2])
마치며…
CSS 관련 지식이 부족하더라도 본문이나 공식문서를 확인한다면 어느 정도 본인에게 필요한 스타일을 적용할 수 있습니다. 그리고 이전 글에서 적은 것처럼 이러한 스타일을 적용하는 것은 시각적으로 이쁘게 보여지는 장점뿐만 아니라 시각적인 정보를 통해 추가적인 정보들을 보여줄 수 있다는 점에서 사용할 가치가 있다고 생각합니다.