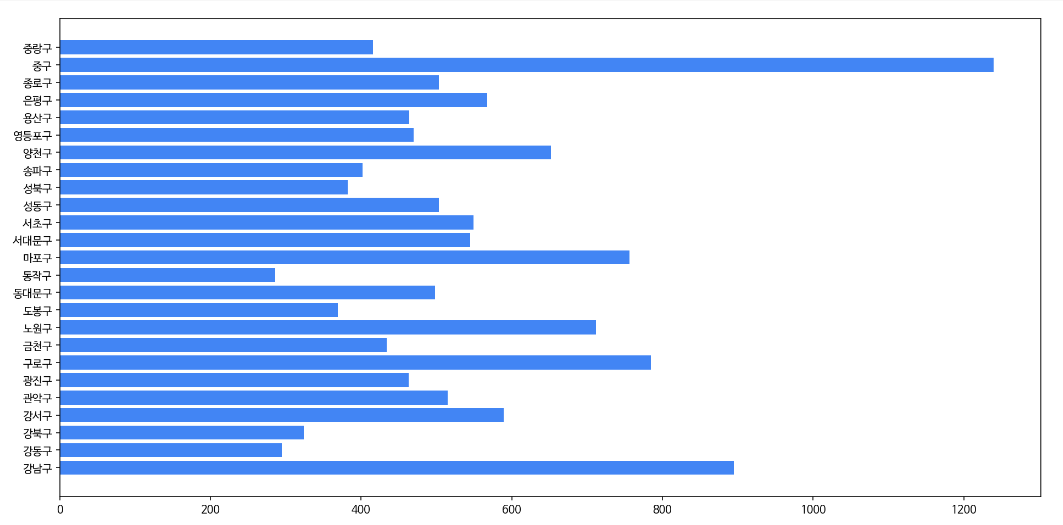
본 글은 Google Colab 기준으로 작성되었습니다.
1
2
3
4
5
6
# Colab 한글 폰트
# 참고링크 : https://velog.io/@heiswicked/%EC%84%B8%ED%8C%85%EC%9D%B4-%EB%B0%98%EC%9D%B4%EB%8B%A4-Google-COLAB-%ED%95%9C%EA%B8%80%ED%8F%B0%ED%8A%B8%ED%8E%B8

!sudo apt-get install -y fonts-nanum
!sudo fc-cache -fv
!rm ~/.cache/matplotlib -rf
1
2
3
4
5
6
7
8
9
10
11
12
13
import os
import warnings
warnings.filterwarnings('ignore')

import numpy as np
import pandas as pd

import matplotlib.pyplot as plt
import seaborn as sns


%config InlineBackend.figure_format = 'retina'
plt.rc('font', family='NanumBarunGothic')
Data 소개
사용된 데이터는 서울 열린데이터광장의 서울시 공공와이파이 위치정보 데이터 입니다.
※ 원 데이터는 좌표가 잘못 입력되는 오류가 있습니다. 이를 미리 처리한 데이터를 이용하여 이후 과정을 진행하였습니다.
1
2
df = pd.read_csv("spatial/서울시 공공와이파이 위치정보(수정).csv")
df
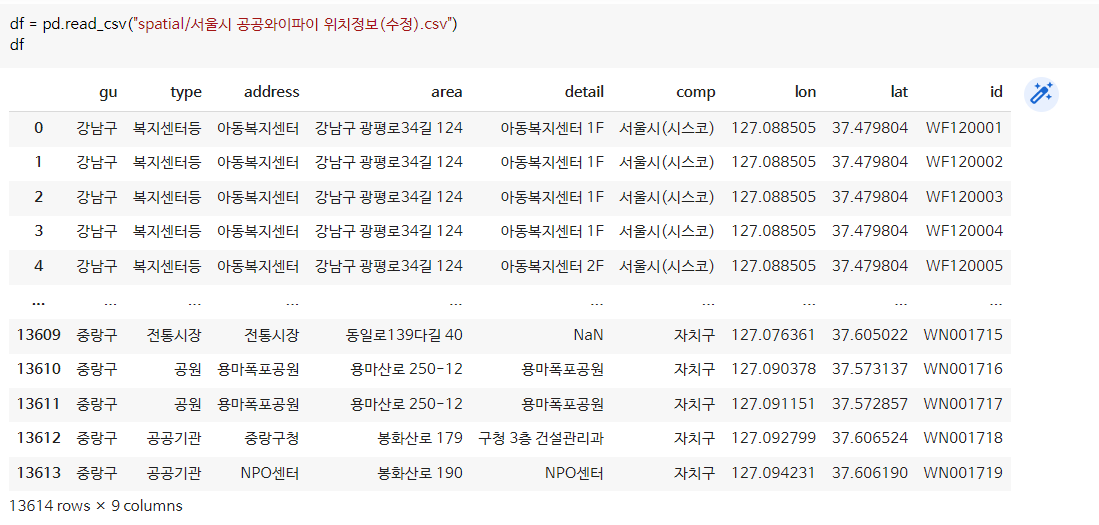
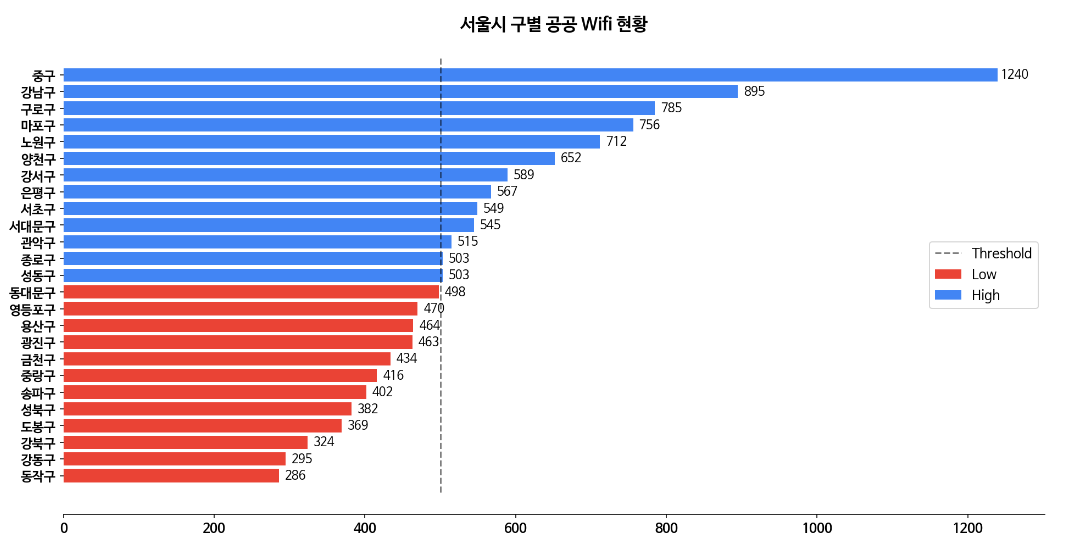
구별 공공 Wi-fi 현황
Before
1
2
3
4
5
6
7
8
9
tmp = df.groupby(['gu'],as_index=False).agg({'id':'count'})

google_colors = ['#4285F4','#EA4335','#FBBC05','#34A853']


fig,ax = plt.subplots(figsize=(16,8))

ax.barh(y=tmp['gu'],width=tmp['id'],color=google_colors[0])
plt.show()
After
1
2
3
4
5
6
7
8
9
10
11
12
13
14
15
16
17
18
19
20
21
22
23
24
25
26
27
28
29
30
31
32
33
34
35
36
threshold = 500

tmp1 = tmp[tmp['id'] <= threshold].sort_values('id',ascending=True)
tmp2 = tmp[tmp['id'] > threshold].sort_values('id',ascending=True)

ax_font_dict = {'fontsize':12,'fontweight':'bold'}
title_font_dict = {'fontsize':16,'fontweight':'bold'}
yticks = list(np.arange(0,len(tmp)))
yticklabels = list(tmp1['gu'])+list(tmp2['gu'])


fig,ax = plt.subplots(figsize=(16,8),sharex=True)

ax.set_yticks(yticks)
ax.set_yticklabels(yticklabels,ax_font_dict)
ax.set_xticklabels(np.arange(0,1400,200),ax_font_dict)

ax.barh(y=tmp1['gu'],width=tmp1['id'],color=google_colors[1])
ax.barh(y=tmp2['gu'],width=tmp2['id'],color=google_colors[0])

ax.vlines(threshold, ymin=-1, ymax=tmp['gu'].nunique(), linestyles='dashed',alpha=0.5)
ax.set_title("서울시 구별 공공 Wifi 현황",title_font_dict)

ax.legend(labels=["Threshold",'Low','High'],loc='center right',fontsize='large')

for i in yticks:
    xx = tmp.loc[tmp['gu']==yticklabels[i],'id'].values[0]
    ax.annotate(xx, xy = (xx, i), xytext = (15,0),
                textcoords = 'offset points',
                ha='center',va='center',fontsize=11)

ax.spines["top"].set_visible(False)
ax.spines["left"].set_visible(False)
ax.spines["right"].set_visible(False)

plt.show()
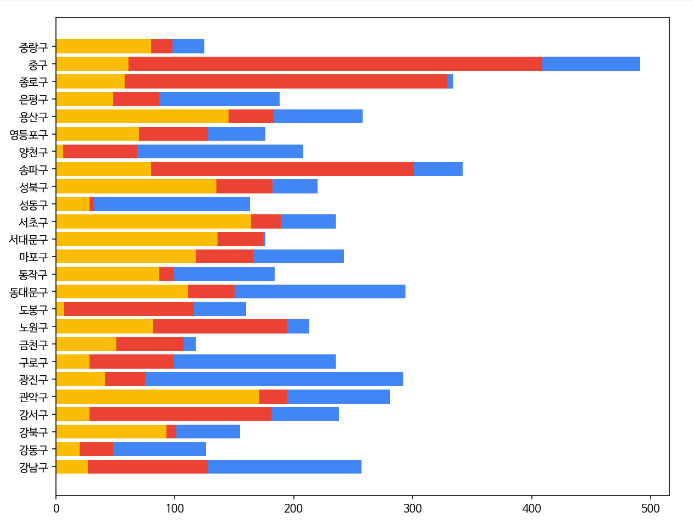
구별, 통신사별 공공 Wifi 현황
Before
1
2
3
4
5
6
7
8
9
10
11
12
13
14
15
16
17
df1['telecom'] = df['comp'].apply(lambda x: re.search("SKT|KT|LGU\+", x).group() \
                        if re.search("SKT|KT|LGU\+", x)!=None else np.nan) \
df1 = df1.dropna(subset=['telecom'], axis=0)
tmp = df1.pivot_table(index=['gu','telecom'],values='id',aggfunc='count').reset_index()

tmp1 = tmp[tmp['telecom']=='LGU+']
tmp2 = tmp[tmp['telecom']=='KT']
tmp3 = tmp[tmp['telecom']=='SKT']


fig,ax = plt.subplots(figsize=(10,8))

ax.barh(y=tmp1['gu'],width=tmp1['id'],color=google_colors[2])
ax.barh(y=tmp2['gu'],width=tmp2['id'],color=google_colors[1],left=tmp1['id'].values)
ax.barh(y=tmp3['gu'],width=tmp3['id'],color=google_colors[0],left=(tmp1['id'].values+tmp2['id'].values))

plt.show()
After
1
2
3
4
5
6
7
8
9
10
11
12
13
14
15
16
17
18
19
20
21
22
23
24
25
26
27
28
29
30
31
32
33
34
35
36
37
38
39
40
41
42
yticks = list(np.arange(0,len(tmp1)))
yticklabels = list(df1.pivot_table(index='gu',values='id',aggfunc='count').reset_index().sort_values('id',ascending=True)['gu'])

tmp1 = pd.merge(pd.DataFrame(yticklabels,columns=['gu']),tmp1,on='gu')
tmp2 = pd.merge(pd.DataFrame(yticklabels,columns=['gu']),tmp2,on='gu')
tmp3 = pd.merge(pd.DataFrame(yticklabels,columns=['gu']),tmp3,on='gu')


fig,ax = plt.subplots(figsize=(16,8),sharex=True)

ax.set_yticks(yticks)
ax.set_yticklabels(yticklabels,ax_font_dict)
ax.set_xticklabels(np.arange(0,1400,200),ax_font_dict)

ax.barh(y=tmp1['gu'],width=tmp1['id'],color=google_colors[2])
ax.barh(y=tmp2['gu'],width=tmp2['id'],color=google_colors[1],left=tmp1['id'].values)
ax.barh(y=tmp3['gu'],width=tmp3['id'],color=google_colors[0],left=(tmp1['id'].values+tmp2['id'].values))

ax.set_title("서울시 구&통신사별 공공 Wifi 현황",title_font_dict)

ax.legend(labels = ['LGU+','KT','SKT'],loc='center right',fontsize='large')

for i in yticks:
    xx1 = tmp1.loc[tmp1['gu']==yticklabels[i],'id'].values[0]
    xx2 = tmp2.loc[tmp1['gu']==yticklabels[i],'id'].values[0]
    xx3 = tmp3.loc[tmp1['gu']==yticklabels[i],'id'].values[0]

    ax.annotate(xx1, xy = (xx1/2, i), xytext = (0,0),
                textcoords = 'offset points',
                ha='center',va='center',fontsize=11)
    ax.annotate(xx2, xy = (xx1+xx2/2, i), xytext = (0,0),
                textcoords = 'offset points',
                ha='center',va='center',fontsize=11)
    ax.annotate(xx3, xy = (xx1+xx2+xx3/2, i), xytext = (0,0),
                textcoords = 'offset points',
                ha='center',va='center',fontsize=11)

ax.spines["top"].set_visible(False)
ax.spines["left"].set_visible(False)
ax.spines["right"].set_visible(False)

plt.show()
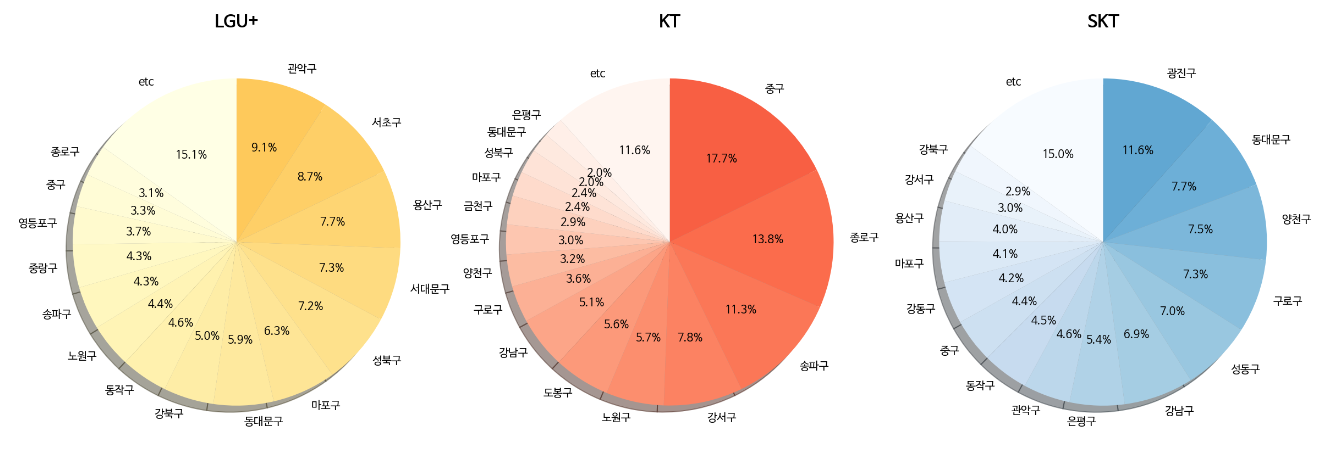
통신사별 공공 Wifi 현황
1
2
3
4
5
6
7
8
9
10
11
12
13
14
15
16
17
18
19
20
21
22
23
24
25
26
27
28
29
30
31
32
33
34
35
36
37
38
39
40
tmp1 = tmp[tmp['telecom']=='LGU+'].sort_values('id',ascending=False).drop('telecom',axis=1)
tmp2 = tmp[tmp['telecom']=='KT'].sort_values('id',ascending=False).drop('telecom',axis=1)
tmp3 = tmp[tmp['telecom']=='SKT'].sort_values('id',ascending=False).drop('telecom',axis=1)

dict_1 = dict(gu=['etc'],id=[np.sum(tmp1[15:]['id'])])
dict_2 = dict(gu=['etc'],id=[np.sum(tmp2[15:]['id'])])
dict_3 = dict(gu=['etc'],id=[np.sum(tmp3[15:]['id'])])

tmp1 = pd.concat([tmp1[:15],pd.DataFrame(data=dict_1)])
tmp2 = pd.concat([tmp2[:15],pd.DataFrame(data=dict_2)])
tmp3 = pd.concat([tmp3[:15],pd.DataFrame(data=dict_3)])

cmap1 = plt.get_cmap("YlOrBr")
cmap2 = plt.get_cmap("Reds")
cmap3 = plt.get_cmap("Blues")

colors1 = cmap1(sorted(np.arange(len(tmp1))*6,reverse=True))
colors2 = cmap2(sorted(np.arange(len(tmp1))*9,reverse=True))
colors3 = cmap3(sorted(np.arange(len(tmp1))*9,reverse=True))


fig,axes = plt.subplots(1,3,figsize=(20,7))

axes[0].pie(tmp1['id'],labels=tmp1['gu'], autopct='%1.1f%%',
        shadow=True, startangle=90, counterclock=False,colors=colors1)
axes[0].axis('equal')

axes[1].pie(tmp2['id'],labels=tmp2['gu'], autopct='%1.1f%%',
        shadow=True, startangle=90, counterclock=False,colors=colors2)
axes[1].axis('equal')

axes[2].pie(tmp3['id'],labels=tmp3['gu'], autopct='%1.1f%%',
        shadow=True, startangle=90, counterclock=False,colors=colors3)
axes[2].axis('equal')

axes[0].set_title("LGU+",title_font_dict)
axes[1].set_title("KT",title_font_dict)
axes[2].set_title("SKT",title_font_dict)

plt.show()
지도 시각화
1
2
import folium
import geopandas as gpd
Base
1
2
3
map = folium.Map(location = [37.564346,126.982062], zoom_start=11,
                 tiles='cartodbpositron')
map
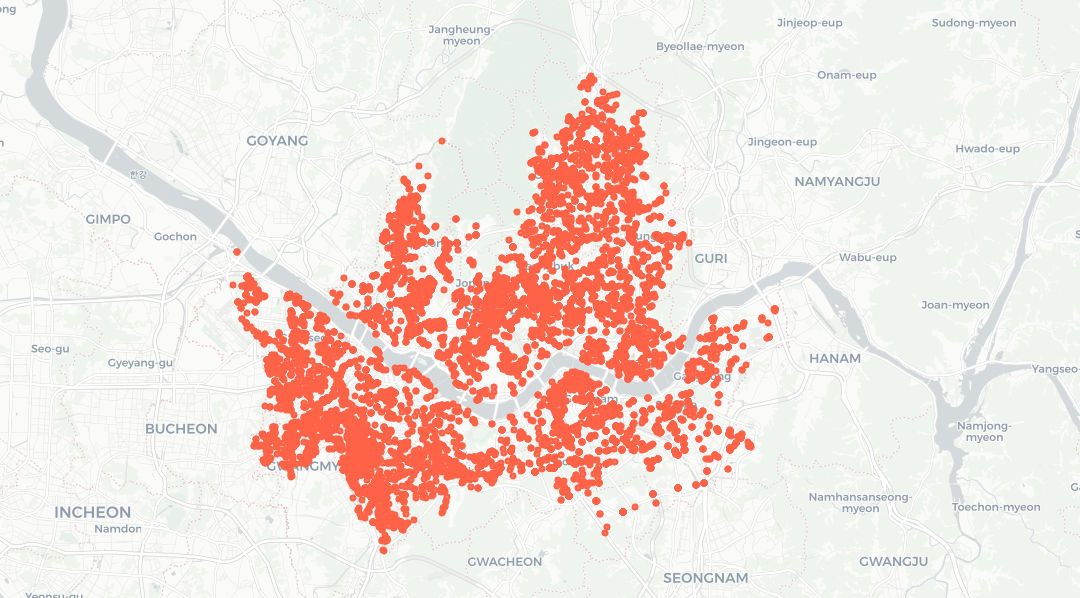
CircleMarker
1
2
3
4
5
6
7
8
9
df = df[df['lon'].isnull()==False]

map = folium.Map(location = [37.564346,126.982062], zoom_start=11,
                 tiles='cartodbpositron')

for row in df.itertuples():
    folium.CircleMarker(location=[row.lat,  row.lon], radius=1.5, color='tomato', fill=True).add_to(map)

map
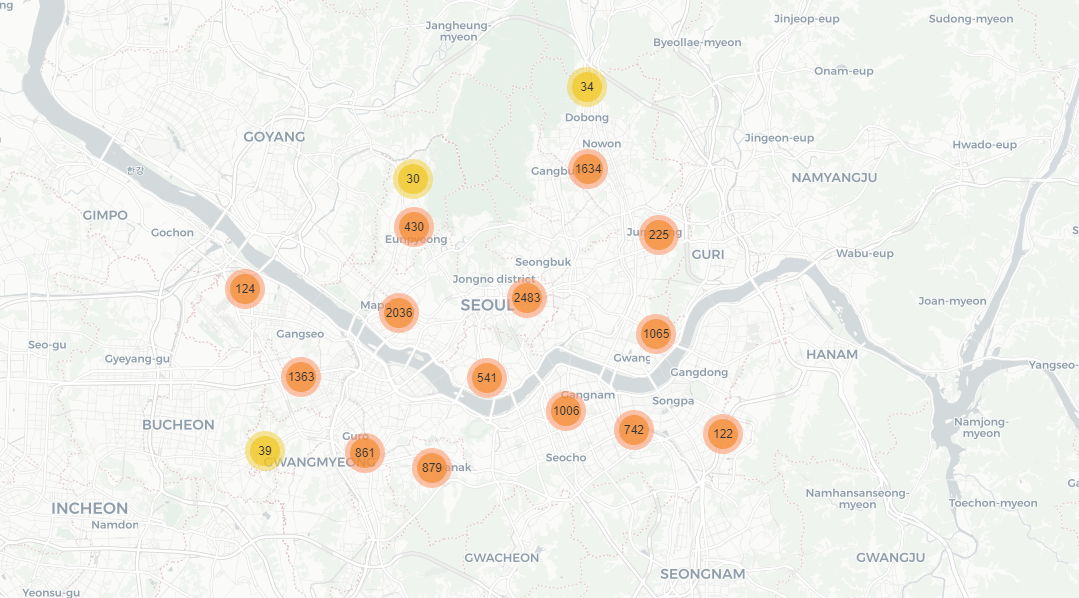
Marker + Cluster
1
2
3
4
5
6
7
8
9
10
11
12
13
from folium.plugins import MarkerCluster

map = folium.Map(location = [37.564346,126.982062], zoom_start=11,
                 tiles='cartodbpositron')

mc = MarkerCluster()
for row in df.itertuples():
    mc.add_child(folium.Marker(location=[row.lat,  row.lon],
                            #    tooltip=row.area
                               ))
    map.add_child(mc)

map
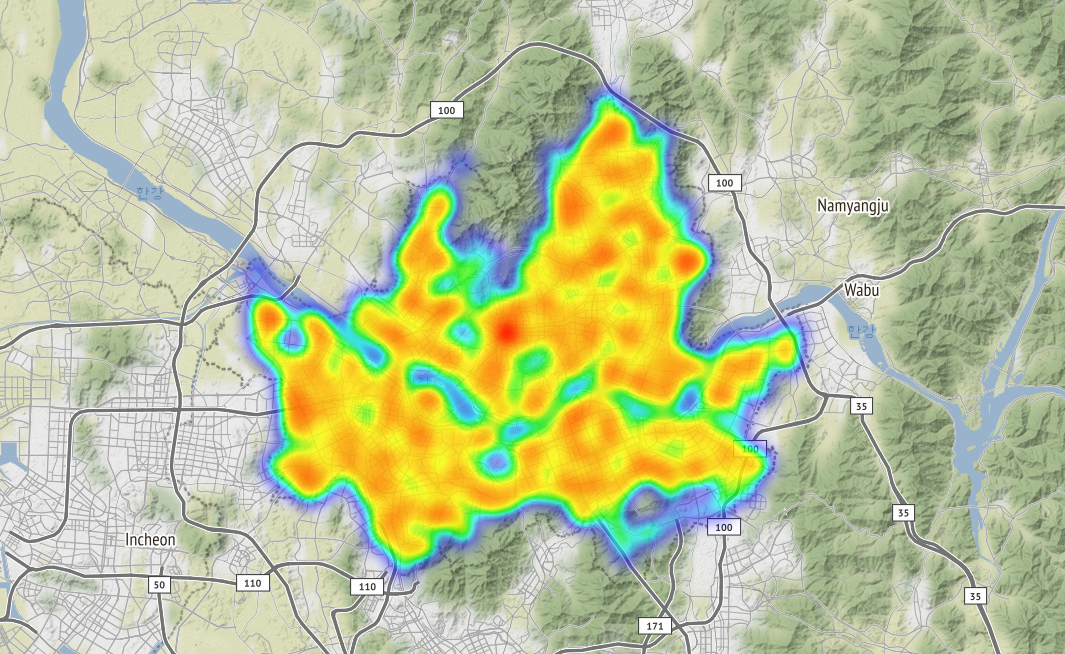
Heatmap
1
2
3
4
5
6
7
8
9
10
from folium.plugins import HeatMap

df1 = [[row['lat'],row['lon']] for index, row in df.loc[:,['lon','lat']].iterrows()]

map = folium.Map(location = [37.564346,126.982062],zoom_start=11,
                 tiles='Stamenterrain')

HeatMap(df1,radius=15,blur=15).add_to(map)

map
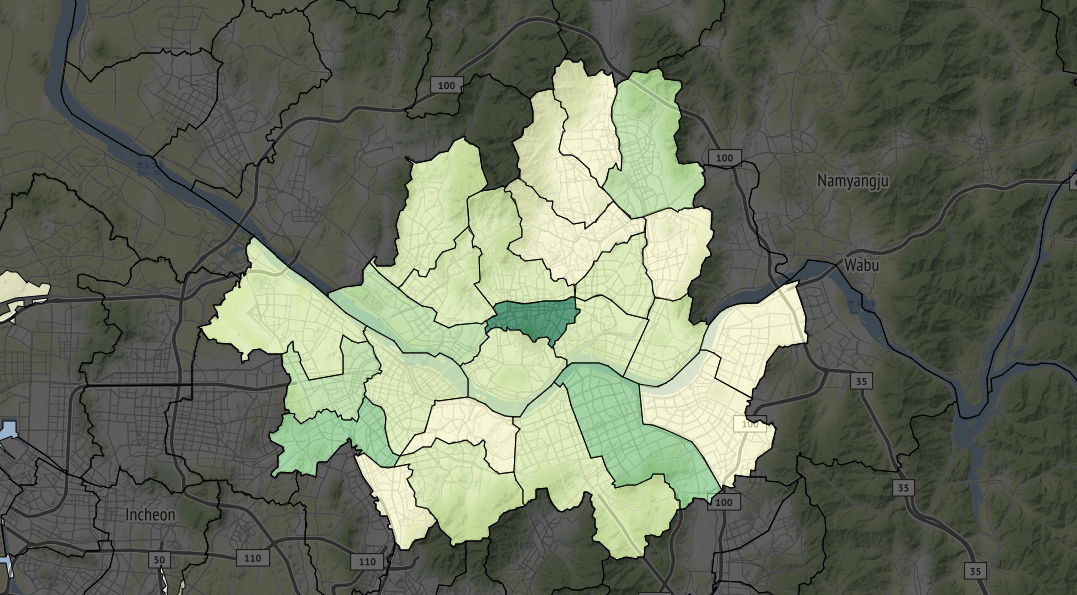
Choropleth
1
2
3
4
5
6
7
8
9
10
11
12
13
14
15
16
17
18
19
20
21
22
23
24
25
26
27
dat = df.groupby('gu').count().iloc[:,0]
dat = dat.reset_index()
dat.columns = ['gu','count']

geo_path = './spatial/geojson/geojson/SIG_202005.geojson'
sig_dat = gpd.read_file(geo_path)

sig_dat['SIG_sub'] = sig_dat['SIG_CD'].str.slice(stop=2)
sig_dat = sig_dat[sig_dat['SIG_sub']=='11']

dat = dat.merge(sig_dat,how='left',left_on='gu',right_on='SIG_KOR_NM')
dat.dropna(inplace=True)

import json
geo_str = json.load(open(geo_path, encoding='utf-8'))


map = folium.Map(location = [37.564346,126.982062],zoom_start=11,
                 tiles='Stamenterrain')

map.choropleth(geo_data = geo_str,
               data = dat,
               columns = ["SIG_CD", "count"],
               fill_color = 'YlGn',
               key_on = 'feature.properties.SIG_CD')

map

